Small influences make a big impact on precision measurement processes
When working with sub-micron and nanometer-sized features any external vibration influence on the equipment will negatively impact resultant measurement data. External vibrations such as nearby machinery, people’s foot traffic, steady-state floor vibration, and other sources have a large impact on how clean the measurement data will be. Ideally, the measurement data from your tool will include no noise from these external influences. Thus, the data will be presented based on the quality of the measurement device, and will not include the impacts of disturbances that exist in the environment.
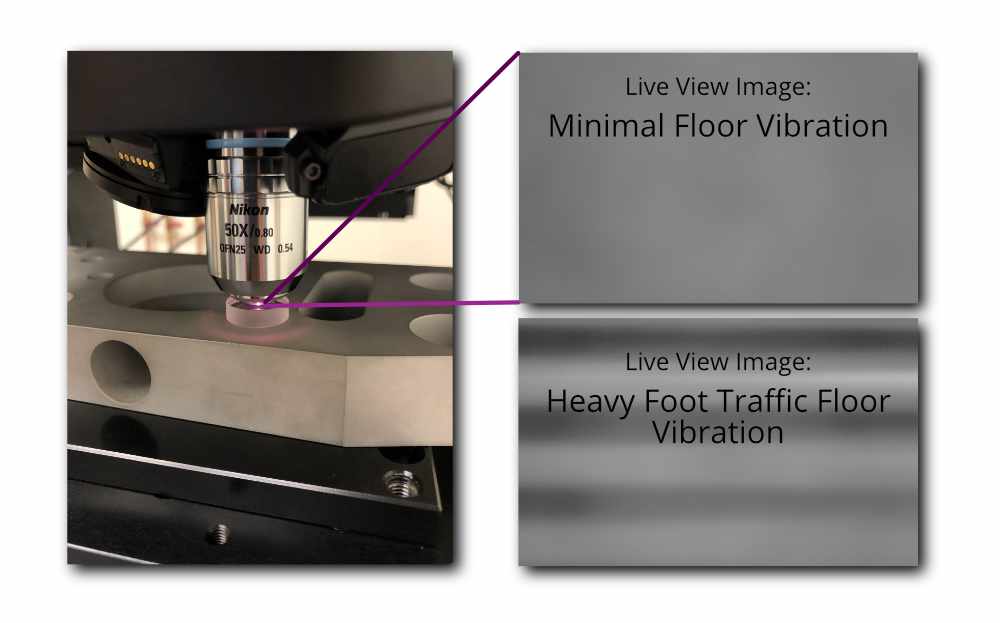
For example, the microscopy measurement taking place below is impacted negatively by people walking close by. The flat optic that the microscope is measuring shows these impacts clearly. The disturbances show up as unwanted artifacts in the live view image of the microscope. These artifacts appear as waves that travel across the image. If data acquisition was occurring at the time when people were walking by the machine the measurement results would include the magnitude of these disturbances. This is undesirable.
Thankfully, there are ways to quantify and characterize the effects of floor vibration so that we can counteract them. Understanding where the negative influences are coming from allows us to make the proper decisions on the type of isolation system required to remove these unwanted disturbances from the measurement system’s results.
Vibration is always present, reduce it
No matter what we do to combat external vibrations there will always be some that shows up in the measurement data. However, we can counteract these vibrations to a point where the measurement data is sufficiently clean. If hundreds of nanometers of noise is acceptable the use of cost-effective isolation materials is appropriate. Alternatively, for processes that are impacted by <100nm of vibration “noise” the use of more sophisticated isolation is warranted.
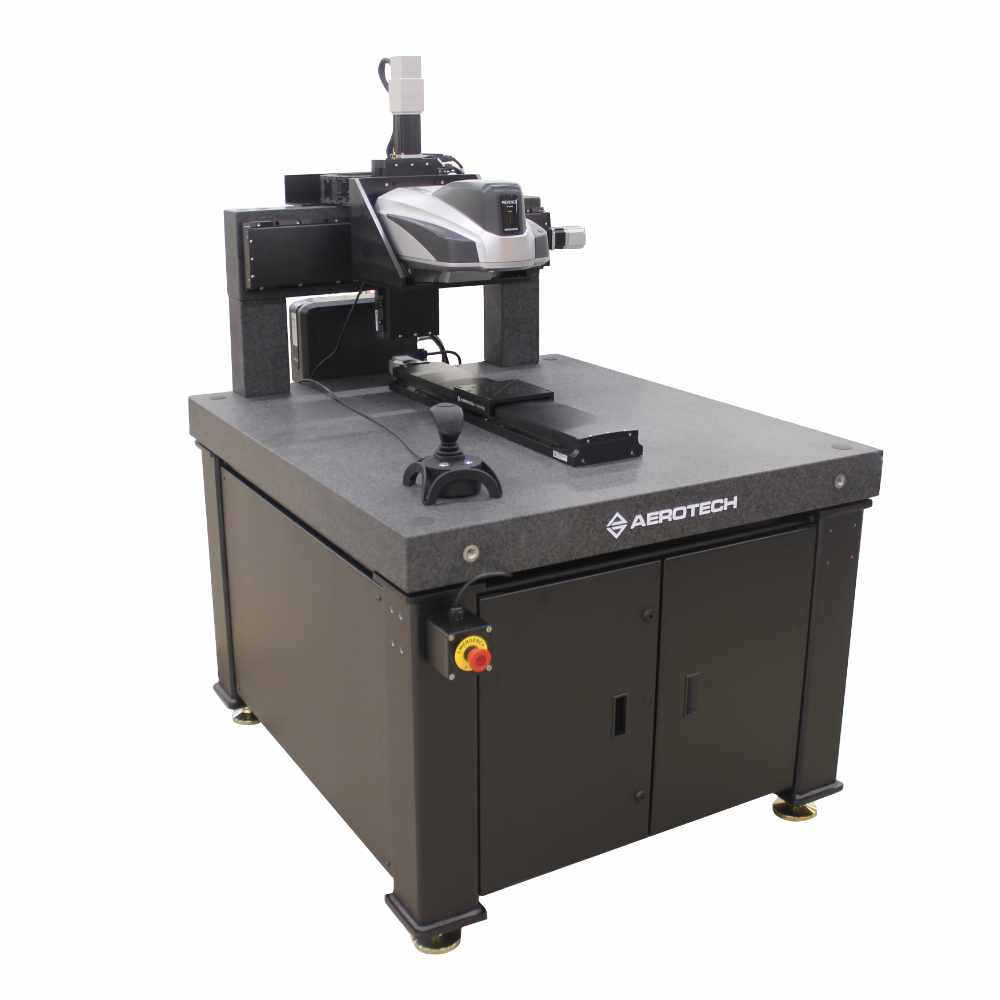
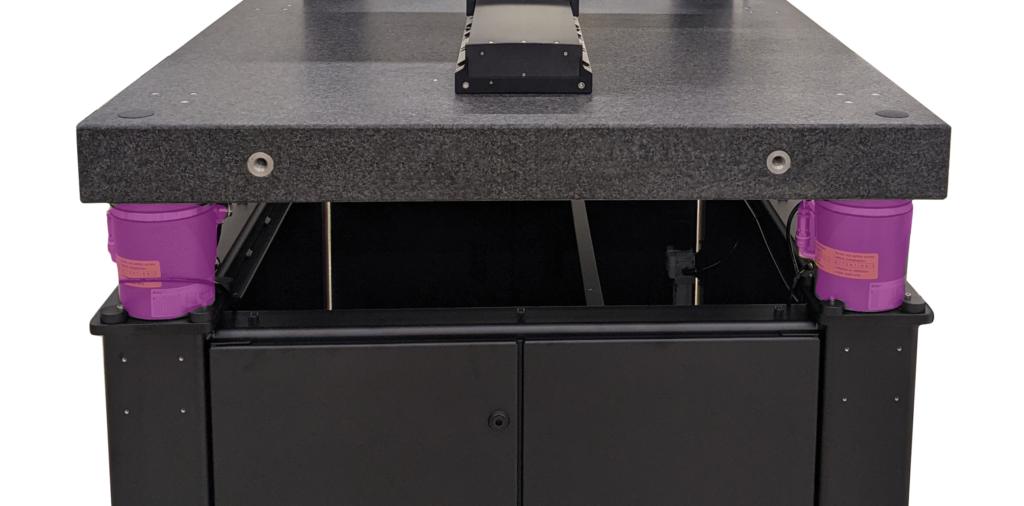
At Peak Metrology we always use at least some form of isolation to guard the measurement system against vibration disturbances. The two that work best for us are passive elastomer isolation and passive air isolation. The former being better suited for lenient vibration isolation needs and the latter being used to knock external vibrations down even further. Additionally, the use of a steel frame and granite base is suggested for sub-micron measurement requirements. The increased mass of these materials helps dampen external influences that make their way to the measurement device and into the resultant measurement data.
Quantifying Vibration
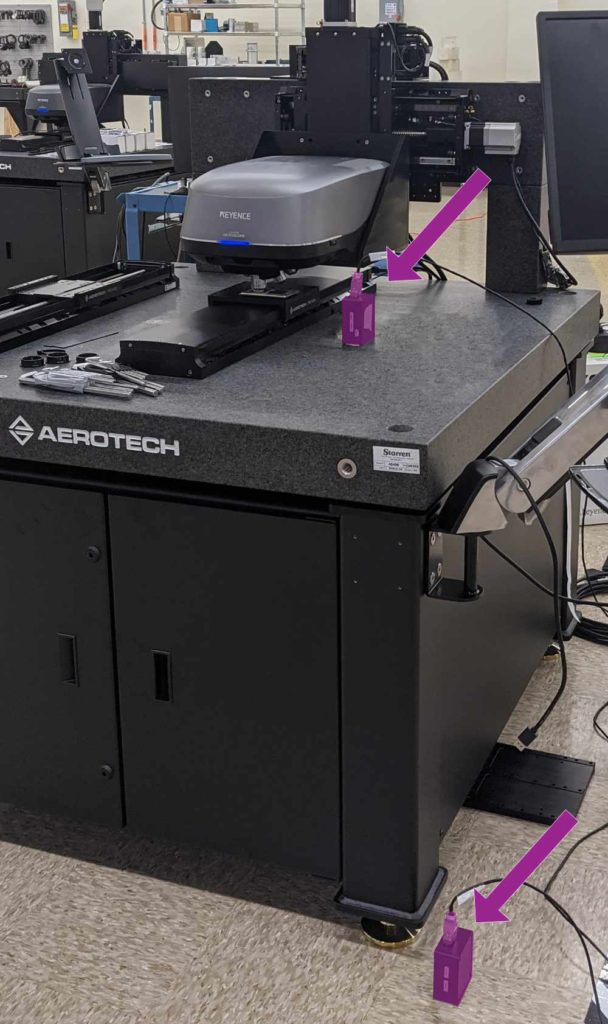
We quantify the effects of floor vibrations using seismic accelerometers. These devices are extremely sensitive and pick up the smallest of vibrations. Using accelerometers we are able to characterize the magnitude and frequency content of the vibrations that make their way to various parts of the equipment. For example, the vibrations seen at floor level include contributions from nearby machinery and people walking around. We measure these disturbances by placing an accelerometer on the floor next to the machine. We then place a second accelerometer on the granite surface to see how well the vibrations are dampened out by the time they reach the measuring surface.
Vibration at Steady State
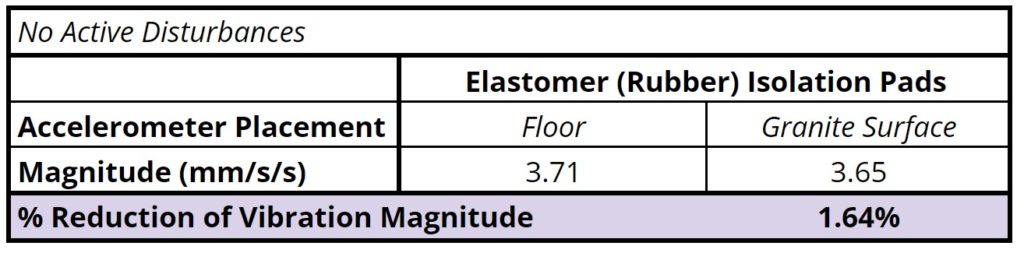
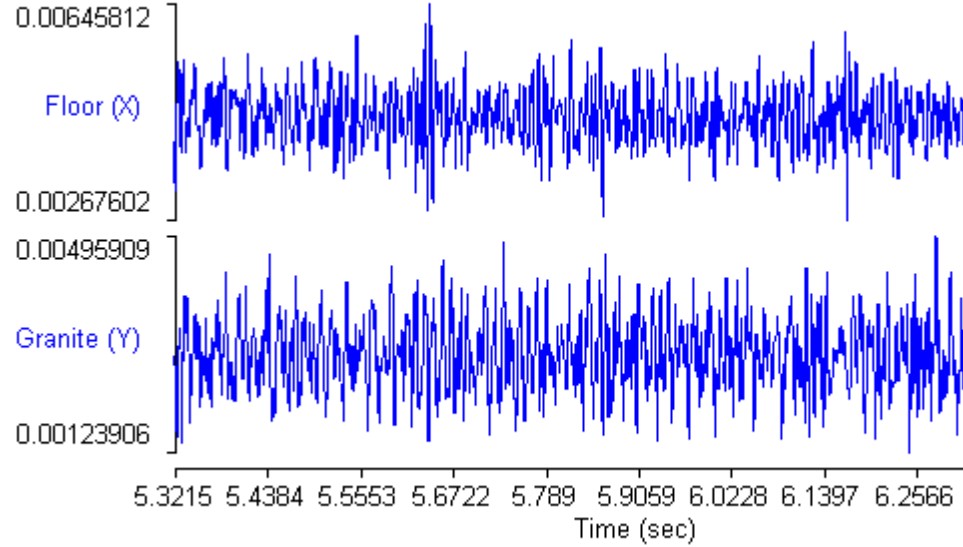
First, we highlight the impacts of floor vibration when the surrounding environment is calm. Nobody is walking nearby and no heavy machinery is being used within the vicinity of the test. This shows the vibration content of the system at rest. Notice from the results below that the magnitude of the vibration is not significantly different between the floor and the top of the granite surface. This is not surprising to us as we have a very stable floor at our facility, and unless there are additional disturbances in the area the granite surface will reflect the steady-state floor. Furthermore, as you can see in the raw data plot below, the frequency content is rather steady and shows no large spikes. More on “large spikes” to come when we show the results from larger disturbances.
Vibration from Larger Disturbances
Now let’s look at the magnitude of the vibration content when more active disturbances occur nearby to the measuring system. Here, we will collect the accelerometer data while somebody walks heavily nearby. Heavy walking is more accurately described as a person stomping within 3 feet of the machine.
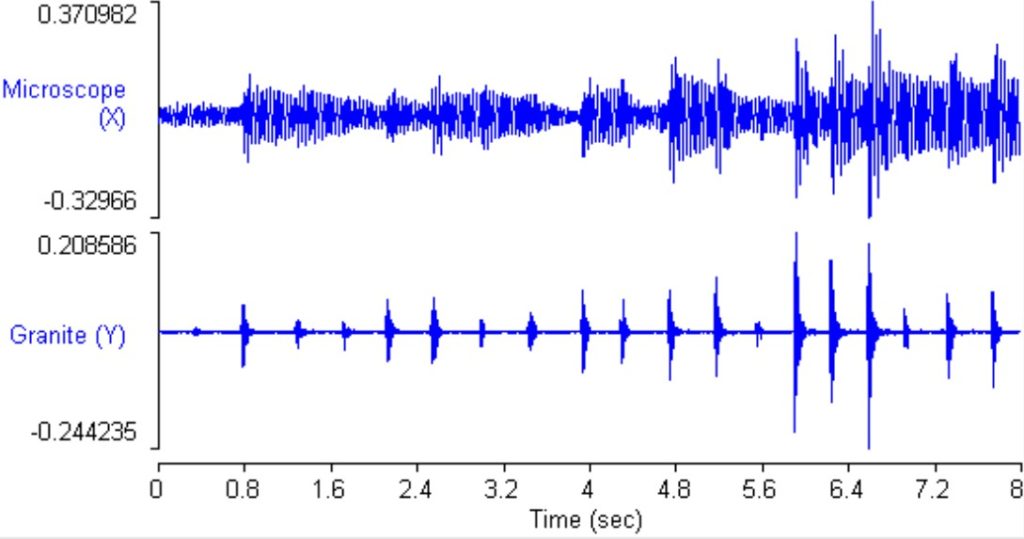
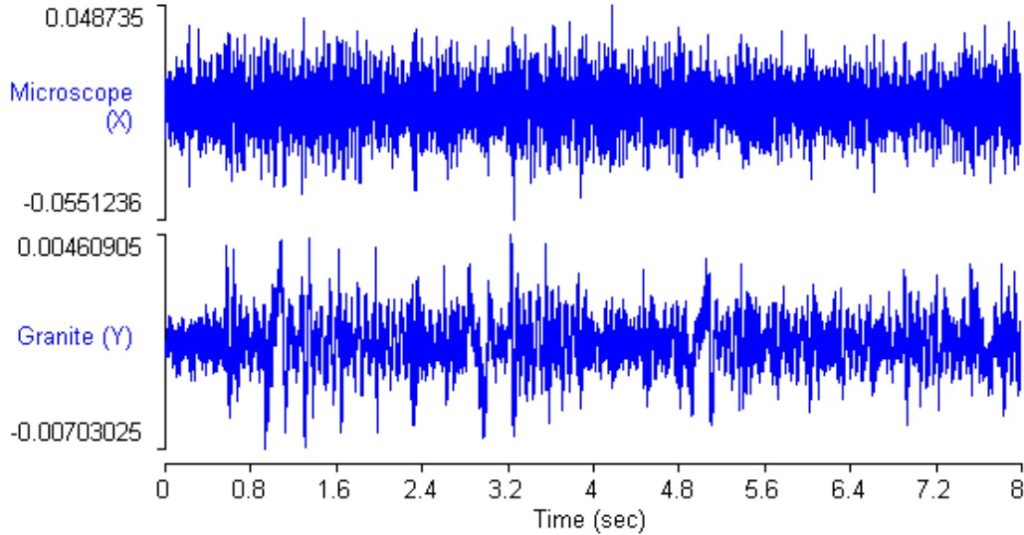
As you can see by the raw data below, every ~½ second another stomp is initiated and the accelerometer picks it up. The accelerations do dampen out over time, but the magnitude of them is such that a sub-micron measurement process would pick up these disturbances inside of the measurement data.
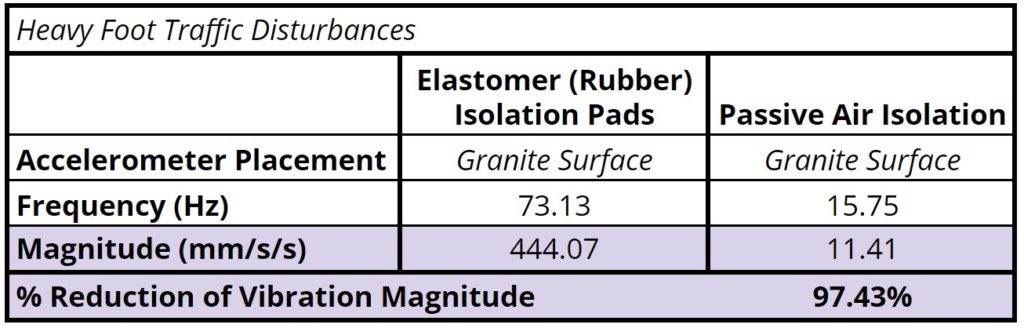
What is most important about these two plots below is the isolation system used to collect each data set. In the first plot only passive elastomer (rubber) isolation pads are used. Also, as shown by the Microscope (X) data the disturbances make their way up to the measuring head itself. Which, in this case, is a microscope. In the second plot, a passive air isolation system was used. This shows a large reduction in the magnitude of the vibration that makes its way up to the granite surface and eventually to the microscope.
Now, when we look at the numerical values for the plots above it is clear that the passive air isolation system helps reduce the magnitude of the disturbance that makes its way back to the granite surface. In fact, there is a >30 times improvement in vibration control when switching from an elastomer isolation pad to an air isolation system.
Conclusions
We’ve determined through the use of seismic accelerometers that isolation systems do limit the amount of vibration that can negatively impact a measurement system. It is also determined that the air isolation system does a much better job at reducing the magnitude of vibration when compared to using only elastomer isolation pads. However, air isolation systems are more expensive and therefore may not be the best choice for all applications. It is important to consider the smallest available measurement resolution of the machine. If the measurement resolution won’t pick up the environmental disturbances in the first place, then elastomer pads would be an adequate solution.
For metrology applications that operate on the micrometer or nano-scale, it is always necessary to incorporate some sort of vibration isolation into the machine design. Even if you don’t think that there are any vibration disturbances in your facility you could be the one creating them by simply walking nearby to the equipment. Using a steel frame, a heavy granite base, and an isolation system in-between will reduce the magnitude of the vibrations present in your measurement data.
For more guidance and consultation on selecting the right positioning system reach out to us.